こちらは「matplotlib」(Pythonライブラリ)のサンプルコードについての記事となっております。
その他、3Dモデルの処理方法についての情報は下記の記事で紹介しております。
open3d/plotly/trimesh/pyvista/vedo/pytorch3d/matplotlibといったPythonライブラリや3DツールのPythonAPIであるbpy(Blender)/unreal(Unreal Engine)といったPythonライブラリについて気になる方はこちらの記事をご覧ください。
目次
- 基本情報 … Basic Information
- サンプルコード … Sample Code
- 001 画像の読み込み, 画像情報の表示 … Read the Image and Get Information from the Image
- 002 画像の読み込み, 画像の表示 … Read and Show the Image
- サンプル出力画像1
- 003 画像の読み込み, 画像の書き出し, 画像の保存 … Read and Save the Image
- 004 データの生成 … Create the Image
- 005 円の描画 … Draw a Circle on the Image
- 006 文字の描画 … Write a Text/Word on the Image
- 007 線の描画 … Draw a Line on the Image
- 008 長方形の描画 … Draw a Rectangle on the Image
- 009 画像の反転 … Flip the Image
- 101 メッシュモデルの読み込み(形式:obj)、メッシュモデルの表示
基本情報 … Basic Information
matplotlibは、Pythonでグラフ描画を行うためのライブラリであり、様々な種類のグラフを描画することができます。主に2Dのグラフを扱い、折れ線グラフ、ヒストグラム、散布図など、多彩なグラフを描画できます。また、LaTeX形式での数式表現や、カスタマイズ性の高いグラフを作成することもできます。
matplotlibは、オープンソースのライブラリであり、豊富なドキュメントとチュートリアルが提供されています。多くのPythonの科学技術コミュニティで利用されており、NumPy、SciPy、pandasなどのライブラリと組み合わせて使うことが多いです。また、Jupyter Notebook上でも使われることが多く、データの可視化や解析に広く利用されています。
サンプルコード … Sample Code
001 画像の読み込み, 画像情報の表示 … Read the Image and Get Information from the Image
import matplotlib.pyplot as plt
import matplotlib.image as mpimg

def main():

    # 変数の定義
    input_path = 'SAMPLE/monkey.png'

    # 画像の読み込み
    image = mpimg.imread(input_path)

    # 画像が読み込めなかった場合の例外処理
    if image is None:
        print(f'Failed to load image from {input_path}')
        return

    # 画像情報の表示
    print(f'data:\n{image}')
    print(f'type: {type(image)}')
    print(f'dtype: {image.dtype}')
    print(f'size: {image.size}')
    print(f'shape: {image.shape}')

if __name__ == '__main__':
    main()
情報の表示
data:
[[[0.8039216 0.8039216 0.8039216 1. ]
[0.8 0.8 0.8 1. ]
[0.8039216 0.8039216 0.8039216 1. ]
…
[0.8 0.8 0.8 1. ]
[0.8 0.8 0.8 1. ]
[0.8 0.8 0.8 1. ]]]
type:
dtype: float32
size: 4665600
shape: (1080, 1080, 4)
002 画像の読み込み, 画像の表示 … Read and Show the Image
import matplotlib.pyplot as plt
import matplotlib.image as mpimg

def main():

    # 変数の定義
    input_path = 'SAMPLE/monkey.png'

    # 画像の読み込み
    image = mpimg.imread(input_path)

    # 画像が読み込めなかった場合の例外処理
    if image is None:
        print(f'Failed to load image from {input_path}')
        return

    # 画像の表示
    plt.imshow(image)
    plt.show()

if __name__ == '__main__':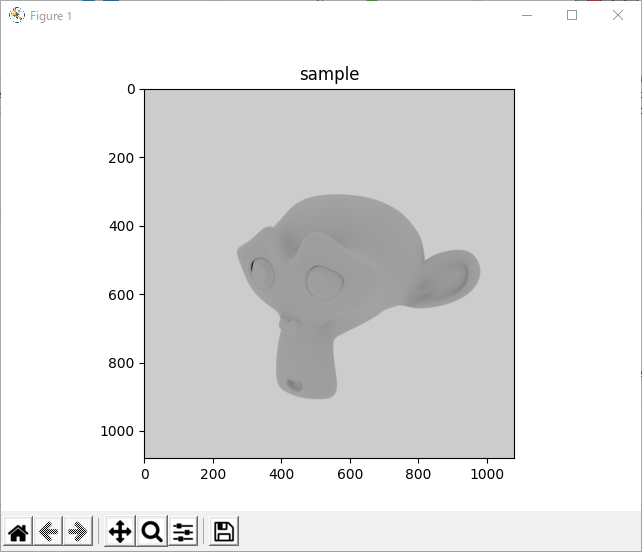
main()このPythonプログラムは、matplotlibライブラリを使用して画像ファイルを読み込んでいます。ここでは、monkey.pngという名前の画像ファイルが読み込まれています。画像は、plt.imread()関数を使用してimgという名前のnumpy配列に格納されます。
print()関数は、img配列の内容を出力します。出力には、各ピクセルのRGBA値が含まれます。img配列には、各ピクセルのRGBA値が含まれる3次元配列が含まれています。img配列のサイズは、img.sizeで取得できます。また、img配列の形状は、img.shapeで取得できます。この例では、img配列の形状は(1080, 1080, 4)で、1080×1080ピクセルの画像で、各ピクセルにはRGBA値が含まれています。
plt.imshow()関数は、img配列を使用して画像を表示します。plt.title()関数は、画像のタイトルを設定します。plt.show()関数は、画像を表示します。
サンプル出力画像1
003 画像の読み込み, 画像の書き出し, 画像の保存 … Read and Save the Image
import matplotlib.pyplot as plt

def main():

    # 変数の定義
    input_path = "SAMPLE/monkey.png"
    output_path = "SAMPLE/monkeyCopy.png"

    # 画像の読み込み
    image = plt.imread(input_path)

    # 画像が読み込めなかった場合の例外処理
    if image is None:
        print(f'Failed to load image from {input_path}')
        return

    # 画像の書き出し, 画像の保存
    plt.imsave(output_path, image)
    print(f"Saved image to {output_path}")

if __name__ == '__main__':
    main()
004 データの生成 … Create the Image
import matplotlib.pyplot as plt
import numpy as np

def show_save_image(image, title, file_name):

    # 画像の表示
    plt.imshow(image)
    plt.title(title)
    plt.axis('off')
    plt.show()

    # 画像の保存
    plt.imsave(file_name, image)

def main():

    # 変数の定義
    output_path_white = "SAMPLE/whiteImage.png"
    output_path_black = "SAMPLE/blackImage.png"
    output_path_blue = "SAMPLE/blueImage.png"
    output_path_green = "SAMPLE/greenImage.png"
    output_path_red = "SAMPLE/redImage.png"

    # 画像となるデータを生成する
    image = np.zeros((400, 400, 3), np.uint8)

    image[:, :] = [255, 255, 255]
    show_save_image(image, 'White Image', output_path_white)

    image[:, :] = [0, 0, 0]
    show_save_image(image, 'Black Image', output_path_black)

    image[:, :] = [255, 0, 0]
    show_save_image(image, 'Blue Image', output_path_blue)

    image[:, :] = [0, 255, 0]
    show_save_image(image, 'Green Image', output_path_green)

    image[:, :] = [0, 0, 255]
    show_save_image(image, 'Red Image', output_path_red)

if __name__ == '__main__':
    main()
005 円の描画 … Draw a Circle on the Image
import matplotlib.pyplot as plt
import numpy as np

def main():

    # 変数の定義
    input_path = "SAMPLE/monkey.png"
    output_path = "SAMPLE/monkeyWithCircle.png"

    # 画像の読み込み
    image = plt.imread(input_path)

    # 画像が読み込めなかった場合の例外処理
    if image is None:
        print(f'Failed to load image from {input_path}')
        return

    # 画像上に円の描画
    fig, ax = plt.subplots()
    ax.imshow(image)
    circle1 = plt.Circle((50, 50), 40, color='g', fill=False, lw=2)
    circle2 = plt.Circle((150, 150), 80, color='cyan', fill=False, lw=6)
    circle3 = plt.Circle((200, 200), 50, color='yellow', fill=True)
    ax.add_artist(circle1)
    ax.add_artist(circle2)
    ax.add_artist(circle3)
    plt.axis('off')

    # 画像の書き出し, 画像の保存
    plt.savefig(output_path)
    print(f"Saved image to {output_path}")

    # 画像の表示
    plt.show()

if __name__ == '__main__':
    main()
006 文字の描画 … Write a Text/Word on the Image
import matplotlib.pyplot as plt

def main():

    # 変数の定義
    input_path = "SAMPLE/monkey.png"
    output_path = "SAMPLE/monkeyWithText.png"

    # 画像の読み込み
    image = plt.imread(input_path)

    # 画像が読み込めなかった場合の例外処理
    if image is None:
        print(f'Failed to load image from {input_path}')
        return

    # 画像上に文字の描画
    plt.text(50, 50, 'Python, Matplotlib', fontsize=12, color=(50/255, 60/255, 80/255), fontweight='bold')

    # 画像の保存
    plt.savefig(output_path)
    print(f"Saved image to {output_path}")

    # 画像の表示
    plt.imshow(image)
    plt.show()

if __name__ == '__main__':
    main()
007 線の描画 … Draw a Line on the Image
import matplotlib.pyplot as plt
import numpy as np

def main():

    # 変数の定義
    input_path = "SAMPLE/monkey.png"
    output_path = "SAMPLE/monkeyWithLine.png"

    # 画像の読み込み
    image = plt.imread(input_path)

    # 画像が読み込めなかった場合の例外処理
    if image is None:
        print(f'Failed to load image from {input_path}')
        return

    # 画像上に線の描画
    plt.imshow(image)
    plt.plot([50, 200], [50, 50], 'r-', linewidth=1)
    plt.plot([50, 200], [100, 100], 'g-', linewidth=5)

    # 画像の保存
    plt.savefig(output_path)
    print(f"Saved image to {output_path}")

    # 画像の表示
    plt.show()

if __name__ == '__main__':
    main()
008 長方形の描画 … Draw a Rectangle on the Image
import matplotlib.pyplot as plt
import matplotlib.patches as patches
from PIL import Image

def main():

    # 変数の定義
    input_path = "SAMPLE/monkey.png"
    output_path = "SAMPLE/monkeyWithRectangle.png"

    # 画像の読み込み
    image = plt.imread(input_path)

    # 画像が読み込めなかった場合の例外処理
    if image is None:
        print(f'Failed to load image from {input_path}')
        return

    # 画像上に長方形の描画
    fig, ax = plt.subplots()
    rect1 = patches.Rectangle((50, 150), 75, 100, linewidth=2, edgecolor='g', facecolor='none')
    rect2 = patches.Rectangle((150, 300), 150, 200, linewidth=6, edgecolor='b', facecolor='none')
    rect3 = patches.Rectangle((350, 600), 225, 300, linewidth=0, edgecolor='r', facecolor='y')
    ax.imshow(image)
    ax.add_patch(rect1)
    ax.add_patch(rect2)
    ax.add_patch(rect3)
    plt.axis('off')

    # 画像の書き出し, 画像の保存
    plt.savefig(output_path, bbox_inches='tight', pad_inches=0)
    print(f"Saved image to {output_path}")

    # 画像の表示
    plt.show()

if __name__ == '__main__':
    main()
009 画像の反転 … Flip the Image
import matplotlib.pyplot as plt
import matplotlib.image as mpimg
import numpy as np

def show_save_image(image, title, file_name):

    # 画像の表示
    plt.imshow(image)
    plt.title(title)
    plt.axis('off')
    plt.show()

    # 画像の保存
    plt.imsave(file_name, image)

def main():
    # 変数の定義
    input_path = "SAMPLE/monkey.png"
    output_path_zero = "SAMPLE/monkeyFlipZero.png"
    output_path_pos = "SAMPLE/monkeyFlipPositiveOne.png"
    output_path_neg = "SAMPLE/monkeyFlipNegativeOne.png"

    # 画像の読み込み
    image = plt.imread(input_path)

    # 画像が読み込めなかった場合の例外処理
    if image is None:
        print(f'Failed to load image from {input_path}')
        return

    # 画像の反転
    new_image = np.flipud(image)
    show_save_image(new_image, "Up <-> Down", output_path_zero)

    new_image = np.fliplr(image)
    show_save_image(new_image, "Left <-> Right", output_path_pos)

    new_image = np.flip(image, axis=(0,1))
    show_save_image(new_image, "Up <-> Down, Left <-> Right", output_path_neg)

if __name__ == '__main__':
    main()
101 メッシュモデルの読み込み(形式:obj)、メッシュモデルの表示
import numpy as np
import matplotlib.pyplot as plt
from mpl_toolkits.mplot3d.art3d import Poly3DCollection

# OBJファイルから頂点と面を読み込む関数
def read_obj_file(file_path):
    vertices = []
    faces = []
    with open(file_path, "r") as f:
        for line in f:
            if line.startswith("v "):
                vertex = [float(v) for v in line.split()[1:4]]
                vertices.append(vertex)
            elif line.startswith("f "):
                face = [int(i.split("/")[0]) - 1 for i in line.split()[1:4]]
                faces.append(face)
    return np.array(vertices), np.array(faces)

# メッシュモデルの読み込む
vertices, faces = read_obj_file("SAMPLE/monkeyTriCopy.obj")

# Matplotlibでメッシュモデルを表示
fig = plt.figure()
ax = fig.add_subplot(111, projection="3d")

collection = Poly3DCollection(vertices[faces], facecolor="blue", edgecolor="black")
ax.add_collection(collection)

# 軸ラベル・範囲の設定
ax.set_xlabel("x")
ax.set_ylabel("y")
ax.set_zlabel("z")
ax.set_xlim(vertices[:,0].min(), vertices[:,0].max())
ax.set_ylim(vertices[:,1].min(), vertices[:,1].max())
ax.set_zlim(vertices[:,2].min(), vertices[:,2].max())

plt.show()